

Citation rate vs. citation share: how to read them without fooling yourself
Two metrics, two denominators, and one very common way to misread both.

A dashboard says your brand has 100% citation share. Another tile says only 37% of responses cite you. Both are correct. If that sounds impossible, you have run into the most common misunderstanding in AI visibility reporting: two metrics that share the word "citation" and use completely different denominators.
This article defines each metric, walks through one dataset, and gives you a short routine for reading them without drawing the wrong conclusion.
Start with the denominators
Every percentage is a numerator divided by a denominator. Most arguments about metrics are really arguments about the denominator, so name it first.
Citation rate answers: in how many answers did we appear?
- Numerator: successful responses with at least one citation to your domain.
- Denominator: all successful responses in the period.
Citation share answers: when answers cite us or a competitor we are tracking, how much of that is ours?
- Numerator: citations to your domain.
- Denominator: citations to your domain plus citations to the competitor domains you track.
Notice what differs. Rate counts responses. Share counts citations. Rate includes responses that cited nobody. Share ignores them. And share only knows about the competitors you chose to list.
A third number people forget: total citations
Answers often cite many domains that are neither you nor a tracked competitor: marketplaces, news sites, review sites, forums. Those count toward "total citations extracted" but not toward citation share. If your tracked competitor list is short, the share denominator can be tiny, and share can jump to an extreme value on a handful of citations.
A worked example (illustrative numbers)
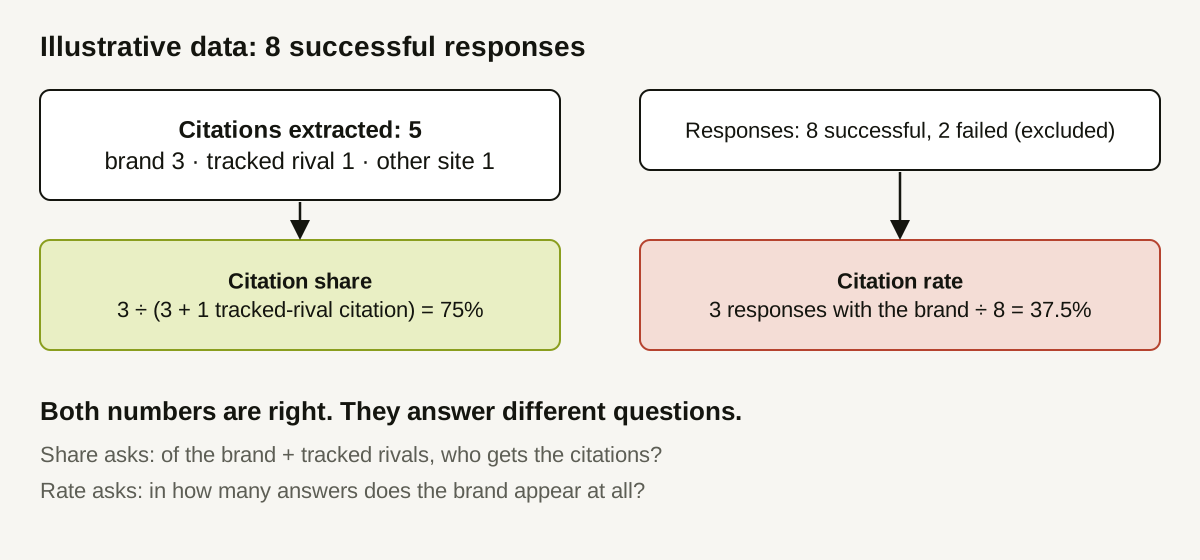
Suppose a team runs a set of questions and gets 10 responses. Two fail and are excluded, leaving 8 successful responses. The extracted citations look like this:
| Domain | Citations |
|---|---|
| Your domain | 3 |
| Tracked competitor | 1 |
| Other sites (not tracked) | 1 |
| Total extracted | 5 |
The three brand citations appear in three different responses.
- Citation rate = 3 responses with a brand citation ÷ 8 successful responses = 37.5%.
- Citation share = 3 ÷ (3 + 1) = 75%.
- Total citations extracted = 5.
Now change one thing: the tracked competitor list is empty. Share becomes 3 ÷ 3 = 100%, because the brand is the only citation in a denominator that contains nobody else. Rate is unchanged at 37.5%. Nothing about the underlying responses changed; only the list of competitors you track.
Four ways these metrics mislead
- Tiny denominators. A share built from 4 citations moves 25 points when one citation moves. Always show the count next to the percentage.
- Unreported exclusions. If failed or pending responses are silently dropped or silently counted as misses, the rate changes. State the rule.
- Percentage points versus percent change. Moving from 20% to 25% is +5 percentage points, not "+25%". Reporting the latter sounds more dramatic and is a different claim.
- "Grew from zero." Going from 0 to 2 citations has no meaningful percentage change. Report the absolute change.
What each metric is good for
- Use citation rate to ask whether your presence is broad. A low rate means most answers do not cite you, whatever the other domains do.
- Use citation share to ask how you stand against named rivals. It is only as good as your competitor list.
- Use total citations to see how much of the conversation belongs to sources nobody is tracking. A large unexplained remainder may mean your competitor list is missing someone.
Neither metric tells you why a number moved. A change in your questions, in which providers returned data, or in the model's behavior can all move them.
When rate and share disagree
The two metrics can move in opposite directions, and each pattern points somewhere different:
- Rate up, share down. You appear in more answers, but tracked competitors are gaining citations faster inside the answers that cite anyone. Look at the questions where rivals appear and you do not.
- Rate down, share up. You appear in fewer answers, but when citations happen you hold a larger fraction of them. This often follows a drop in how many sources assistants cite overall, or a competitor that stopped being cited. Check total citations before celebrating.
- Rate flat, share swings. Suspect a small denominator or a change in the competitor list. Add the counts to the report and re-read.
- Both flat, total citations up. Other, untracked domains are gaining ground. Review which new domains appear.
In each case the metric alone cannot assign a cause. It tells you where to open the raw responses.
Reporting both honestly in one sentence
A useful template is: "In the week of [date], our domain was cited in X of Y successful responses (rate), and held Z of N citations across us and [named competitors] (share)." The sentence is long on purpose. It carries both denominators and the competitor scope, so a reader cannot mistake one for the other.
A reading routine
- Read the denominator and the count first. Is it 3 of 4 or 300 of 400?
- Check coverage: how many responses succeeded, and which providers returned data?
- Compare rate and share. If they disagree, ask which denominator explains it.
- Check the tracked competitor list. Is the share denominator meaningful?
- Look at the raw responses behind any big movement before explaining it.
- Write the claim in the narrowest accurate words: "Our domain appeared in 3 of 8 successful responses," not "AI loves us."
How Doclight reports these
Doclight's reports keep these metrics separate and label the scope. The report carries total citations extracted, brand citations, citation rate with the number of eligible successful responses, and citation share with a note describing its denominator. When the share denominator is zero, the report shows that share is unavailable instead of inventing 0%. Failed and pending responses are excluded from citation rate. Period-over-period comparisons distinguish "no baseline," "no change," and "new from zero," and share changes are given in percentage points.
The limits: Doclight counts links and domain strings, so brand names written without a link do not count, and share only covers competitors you added. A provider's per-provider share uses yet another scope (your citations divided by all domains cited by that provider), so a provider that mostly cites unrelated sources can show a low figure even when you lead your tracked rivals.
Checklist
- The denominator is written next to every percentage.
- Failed responses are reported separately.
- Competitor list reviewed this month.
- Changes reported in percentage points or absolute counts.
- Raw responses sampled before explaining a shift.
For a starting point, see how to establish an AI visibility baseline, and for a review rhythm, a weekly monitoring routine.
Sources and verification
Metric definitions were checked against Doclight's metric definitions and analytics code on 2026-10-12. All numbers in the example are illustrative.
If your brand rarely appears at all, work through why your company might not show up in ChatGPT recommendations.