

How SEO agencies can structure an AI visibility report for clients
Scope, coverage, results, competitors, actions, limits: a six-part outline that survives a skeptical client.

Agency clients have started asking whether ChatGPT, Perplexity or Google's AI features mention them. Answering well is partly a measurement problem and partly a communication problem. Measurements in this area are noisy, vary by provider, and cannot promise outcomes, so a report that reads like a ranking dashboard invites the wrong conclusions. A report that states its scope and limits earns trust, including when the news is not good.
This article proposes a six-part structure that works for a monthly or quarterly client deliverable. It assumes you are measuring through a consistent question set; if you are still building one, see how to establish a baseline.
The outline at a glance
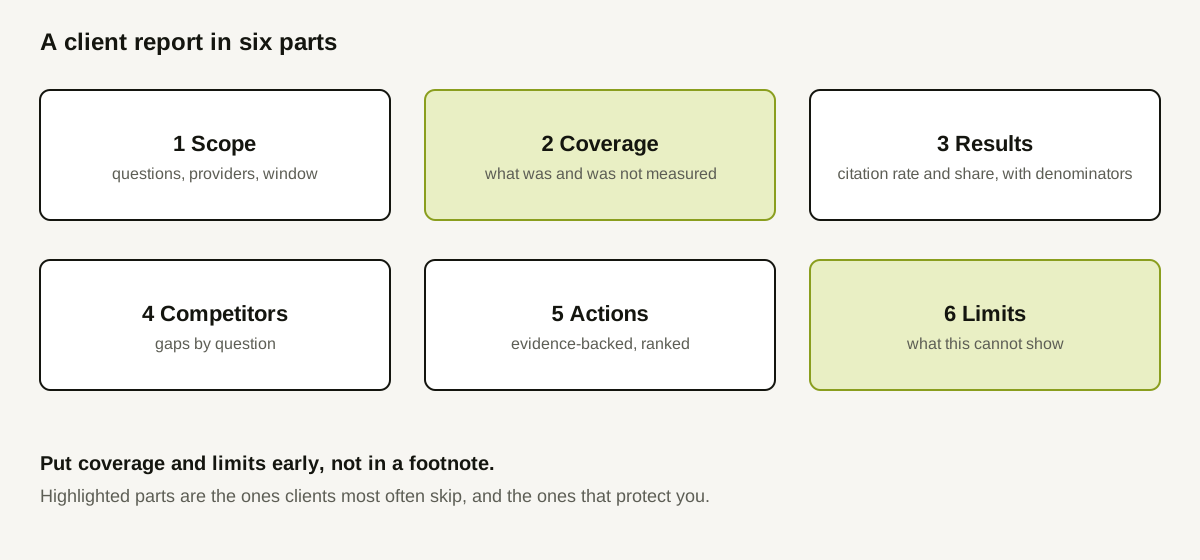
1. Scope: what was measured
Open with one short block a client could paste into an email:
- the tracked questions (a count, with the full list in an appendix),
- the providers measured,
- the window, in dates,
- the market (language and country setting), if relevant,
- the tracked competitors.
Why first? Every number later is conditional on this block. If a client reads nothing else, they should know that "visibility" here means how often tracked brands were cited in answers to these questions on these providers, nothing broader.
2. Coverage: what was not measured
Report attempted, successful, failed and pending responses. A provider that failed all week is a coverage hole, not a result. If coverage was incomplete, label the whole report that way and avoid comparing it with a complete month as though they match. Putting this section second prevents the common failure where a drop in a number is really a drop in measurements.
3. Results: with denominators
Present the headline metrics beside the thing they are divided by:
- Citation rate: successful responses with at least one citation of the client, divided by successful responses.
- Citation share: the client's citations divided by the client plus tracked competitors' citations.
Add change since the previous comparable period, in percentage points. If no comparable period exists, say "first measurement." For why two percentages can disagree, see citation rate vs. citation share.
4. Competitors: gaps by question
Show the questions where a tracked competitor was cited and the client was not, with how many successful responses sit behind each. This is the section clients remember, so keep it factual: list the gaps and the pages cited, and avoid ranking language. Investigating those gaps belongs in your work plan, not in a verdict.
5. Actions: ranked, with evidence
Convert findings into a short list. Each item states the evidence, the proposed change, who owns it, and how you will verify it. Tag each as fix (an access or technical error), investigate (a measured gap with unknown cause), or measure (a data gap). Do not promise that an action will produce a citation. Say what you will re-measure and when.
6. Limits: stated plainly
Close with a fixed paragraph, reused every month:
- Measurements come from provider APIs and may differ from what a consumer chat product shows.
- Results vary between runs and between providers.
- Citation is not the same as recommendation, traffic or revenue.
- Crawler or request data, if included, shows access, not intent.
A worked example (illustrative)
A hypothetical agency prepares a March report for a client, "Northwind Tools." All figures below are invented.
| Section | Content |
|---|---|
| Scope | 40 questions, 3 providers, March 1 to 31, en-US, 3 tracked competitors |
| Coverage | 360 attempted responses, 342 successful, 14 failed, 4 pending; Provider 3 failed on 6 days |
| Results | Citation rate 27% (up 4 points on February); share among tracked domains 31% |
| Competitors | Competitor A cited and client absent on 6 questions; 2 of them repeated across providers |
| Actions | Fix: pricing page blocked for crawlers (verified). Investigate: 2 repeated gaps. Measure: Provider 3 re-run |
| Limits | Standard paragraph |
The agency's note to the client says: "The 4-point rise is within a month where one provider was only partly measured; we will confirm it next month." That sentence costs credibility in the short term and builds it over the quarter.
Packaging and delivery
Decide up front how clients receive the report. A shareable link is convenient but can expire; an exported file is durable. Whichever you use, keep an archive of what each client was told each period, so that next quarter's comparison uses the same definitions. Do not reinterpret old reports under new rules.
If you work with several clients, keep each client's brand, question set and competitors separate, and never mix their numbers in one table.
How Doclight helps
Doclight reports carry the scope with the numbers: window, providers, denominators and coverage, including attempted, successful, failed and pending response counts. A report can be exported as JSON, CSV or PDF, or shared as a read-only link; shared links are snapshots that expire after 30 days and can be revoked, and a snapshot frozen under an older metric definition is flagged as legacy instead of silently reinterpreted. Separately, fully ended calendar months and quarters are archived as immutable snapshots, and two archived periods can be compared only when they are actually comparable (same providers, enough overlap in questions, same locales); otherwise the reasons are listed and no deltas are shown. Workspaces let a team organize client brands, and scoped API credentials exist for reading report summaries programmatically.
Report branding exists for workspaces on a qualifying subscription tier, and applies only while that subscription is active. Confirm current plan details on the pricing page rather than assuming.
Doclight does not write your commentary, and it cannot show what a client's customers saw in a consumer chat app.
Checklist
- Scope block written and pasted at the top.
- Coverage reported before results.
- Rate and share both shown, with denominators.
- Changes in percentage points, with "first measurement" where there is no baseline.
- Competitor gaps listed with response counts.
- Actions tagged fix, investigate or measure, with a verification step.
- Standard limits paragraph included.
- Each period archived exactly as delivered.
Sources and verification
Checked on 2026-10-12 against this repository: METRIC_DEFINITIONS.md (report snapshots, comparability rules, legacy snapshot flag), the shareable-report and export routes in backend/app/analytics/routes.py (30-day share expiry, JSON/CSV/PDF export), and the workspace branding gate in backend/app/billing/limits.py. No external research is cited and no client data is used. "Northwind Tools" and all numbers are invented examples.