

How to compare your brand's AI visibility with competitors without fooling yourself
Fix the scope first, name the denominator, and treat a gap as a question to investigate.

To compare your AI visibility with competitors, measure both brands on the same fixed set of questions, the same AI assistants and the same time window, report each number with its denominator, and treat a gap as a question to investigate rather than a verdict. A screenshot of one answer naming a rival is not a comparison.
Every team eventually asks the same thing: "How do we stack up against our competitors in AI answers?" It is a reasonable question, and an easy one to answer badly. A screenshot of one assistant naming a rival is not a comparison. This article shows how to build one you can defend: fixed scope, named denominators, and a conclusion that stops where the evidence stops.
If you are new to the underlying numbers, start with what AI visibility actually measures and citation rate vs. citation share.
Step 1: Decide who counts as a competitor
In answer engines, your competitors are the domains that get cited for the questions your buyers ask, which may not be the companies on your sales deck. Start with three groups:
- Direct competitors that sell the same thing.
- Adjacent products a buyer might choose instead.
- Reference sources (review sites, marketplaces, publications) that assistants lean on.
Only the first two belong in a brand-versus-brand comparison. Reference sources matter, but they are a different analysis: you cannot out-compete a news site, you can only appear next to it. Keep the list short, three to five tracked competitors, because every extra name changes the denominator you will report.
Step 2: Hold the scope fixed
A comparison is fair only when everyone is measured the same way. Write down, before you look at any result:
- The question set. One list of tracked questions, run unchanged. Editing a question mid-comparison changes what is being measured.
- The providers. The same assistants, measured through the same method.
- The window. One date range, with the prior period defined the same way.
- The market. The same language and country setting for every question you include.
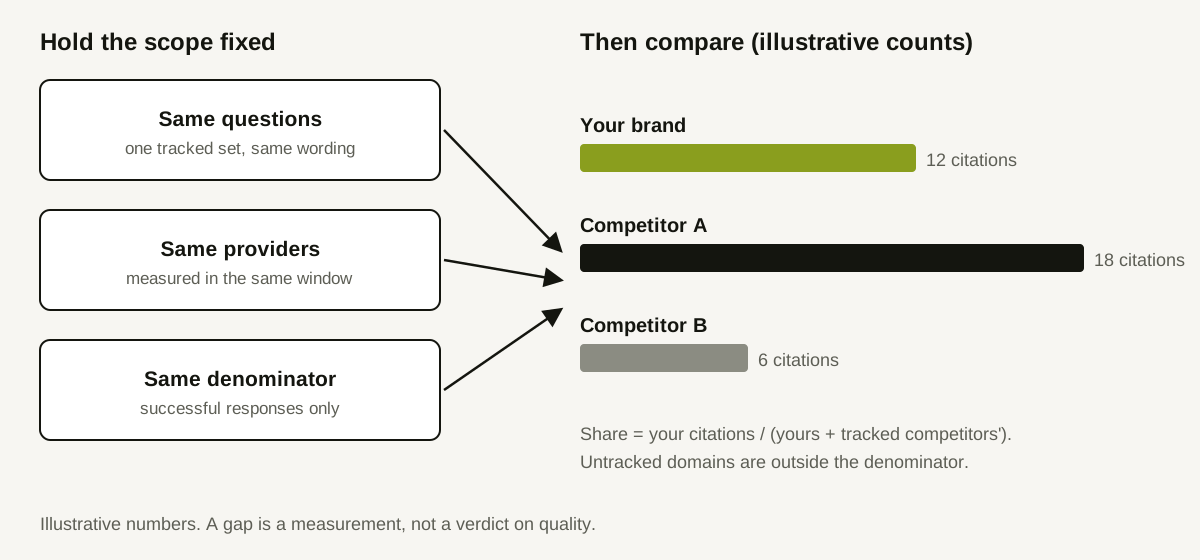
If a competitor is only measured on some questions, report those questions separately instead of averaging them in.
Step 3: Name the denominator
Two numbers look similar and mean different things:
- Citation rate is the share of successful responses in which a domain was cited at least once. The denominator is responses.
- Citation share is a domain's citations divided by the citations of your brand plus your tracked competitors. The denominator is citations among tracked domains.
Share has a trap built in. Citations to untracked domains (a marketplace, a blog, a competitor you forgot to add) are outside the denominator, so adding or removing a tracked competitor changes everyone's share without any change in the answers. Always say which competitors were tracked when you quote a share.
Failed or pending responses should be excluded and counted separately. A provider that errored for half the questions is a coverage gap, not a competitor win.
Step 4: Check you have enough data
Small samples invite stories. Before you read a difference, check how many successful responses are behind it. A gap resting on a handful of responses can reverse next week. If the sample is thin, say "not enough data yet" and extend the window rather than ranking brands.
A worked example (illustrative)
A SaaS team tracks 30 questions across three providers and two competitors, over 30 days. The numbers below are invented to show the method, not real results.
| Domain | Successful responses citing it | Citations | Share of tracked citations |
|---|---|---|---|
| Your brand | 31 of 90 | 12 | 33% |
| Competitor A | 46 of 90 | 18 | 50% |
| Competitor B | 15 of 90 | 6 | 17% |
Reading it honestly:
- Competitor A is cited in about half of responses, you in about a third. That is a measured gap on this question set.
- Share (33% versus 50%) is computed only among the three tracked domains. If a fourth, untracked competitor were cited often, it would not appear here.
- Nothing in the table says why Competitor A is cited more. It could be better pages, stronger third-party coverage, or the way these particular questions are phrased.
The team's next step is not "copy Competitor A." It is to find the questions where Competitor A is cited and they are not, which is the subject of the next article on investigating those gaps.
Step 5: Compare over time, not once
A single window is a snapshot. The more useful question is whether the gap is widening or closing. Compare against an earlier period with the same question set and providers, and report changes in percentage points for rates and shares, never as a percentage of a percentage. If the earlier window had no data, report "first measurement" rather than inventing a baseline. For a routine that keeps this honest week after week, see a weekly monitoring routine.
What to write in the summary
Keep it to four lines a stakeholder can check:
- Scope: questions, providers, window, market, tracked competitors.
- Result: rate and share, with the denominators.
- Coverage: what failed or was not measured.
- Interpretation: what the data supports, and one thing it does not.
Avoid verbs like "beats" and "loses to." Prefer "was cited in more of the measured responses."
How Doclight helps
Doclight lets you track competitors against a brand, and its report states the denominator beside each number. Citation share is computed against the brand plus tracked competitors, and the report discloses that scope; when that denominator is zero, share is shown as unavailable instead of a made-up 0%. The competitor deep dive lists the questions where the competitor was cited and your brand was not, and the cited destination pages, so a gap leads straight to evidence. Period comparisons separate "no baseline," "no change," and "appeared from a measured zero" instead of printing a misleading percentage.
Doclight does not tell you why a competitor is cited, and it measures through provider APIs, which may differ from what a consumer chat app shows. See the metrics documentation for each definition.
A short checklist
- Competitors chosen and listed (three to five).
- Question set, providers, window and market written down before analysis.
- Rate and share both reported, with denominators.
- Failed and pending responses excluded and disclosed.
- Sample size checked before ranking anyone.
- Conclusion limited to "cited more often on this question set."
Sources and verification
Checked on 2026-10-12 against this repository's code and documentation: METRIC_DEFINITIONS.md (citation share and rate denominators, comparison semantics) and the competitor deep-dive implementation in backend/app/analytics. No external research is cited, and no customer data is used. The table is illustrative.